Six Sigma Tutorial
Objectives of Six Sigma
This Six Sigma tutorial will guide you through the basic building block of Six Sigma's two main objectives.
Traditionally, Six Sigma's focus has always been on reducing variation and improving process capability to reduce defects. Under this traditional view, Six Sigma has two main objectives:
1. Center the process to match the target.
2. Reduce the variation in the process to the point that +/- 6 standard deviations (sigma) of your process are in between the upper and lower specification limits.
To understand this, we will have to revisit the concept of the normal distribution curve. To the lay man, it's known as the bell curve. See picture below.
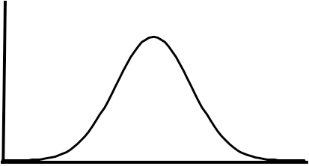
The normal distribution curve is an illustration of the frequency or count of the number of times a value is recorded for a process. The normal distribution curve is defined by two numbers - the mean and the standard deviation. The mean defines where the curve is centered around. The standard deviation defines how wide or narrow the curve is. The higher the standard deviation, the wider the curve. The two curves below have the same mean, but the curve on the right has a higher standard deviation since it is a wider curve.

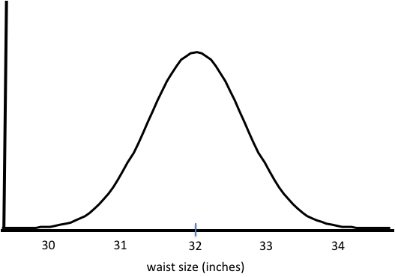
For an example in this Six Sigma tutorial, let's say your factory is producing jeans. One of the important outputs of your process will be the waist size of the jeans. If your process is meant to produce jeans of 32 inches waist size and assuming that the process is not broken - you should be getting jeans with 32 inches waist size coming out of your process most of the time. Sometimes, they may be 31.9 inches…or perhaps 32.1 inches (0.1 inches more or less than the target). Rarely, the process could come out with 31 inches our 33 inches (1 inch more or less than the target). Extremely rarely, they could be 30 inches or 34 inches (2 inches more or less than the target). As the measurement moves away from the center, it becomes less and less likely that the corresponding value will occur. That is why the normal distribution curve is highest in the middle and gets lower and lower on the sides. The distribution curve of the jeans example may look like the picture below.
Customers understand (at least most do) that there is variation in everything in life and that it is close to impossible to hit the exact same measurement every time. Therefore they give their suppliers tolerances in their specifications. If we go back to the jeans example, the customer might be willing to accept jeans that are plus or minus 1 inches from the target (this is of course very lenient, but let's say this is the case for this six sigma tutorial). In the case of the 32 inch waist size jeans, this would mean that 31 inches will be the lower spec limit (LSL) and 33 inches will be the upper spec limit (USL). Anything between these two measurements is considered to be a good product. Anything outside of these two measurements is considered to be a defect.
So what if your process looked like this?
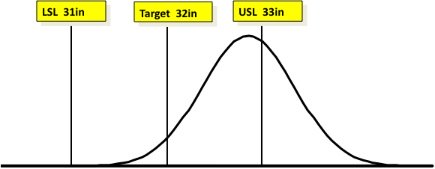
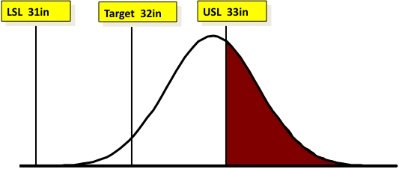
That is not a very good process! As you can see the mean of this process is closer to 33 inches than 32. It looks like almost half of the jeans that come out of this process will be defective items since the waist size will be over the USL of 33. This is illustrated graphically below. The area in red will all be values over 33 inches. These will all be defective items which the customer cannot accept. It looks like roughly about 40% of the total items will be defective!
As mentioned right in the beginning of this Six Sigma tutorial, the first objective is to center the process to the target. Six Sigma tools and concepts will be used to change the process so that the curve can be moved to be centered with target. The changed process is shown below. The center of the curve is now in line with the target of 32 inches. Although we still have some defective items with this new process (a few pieces less than 31 inches and few pieces greater that 33 inches), it is minuscule compared to the amount of defective items prior to centering. The defective areas are shown in red.
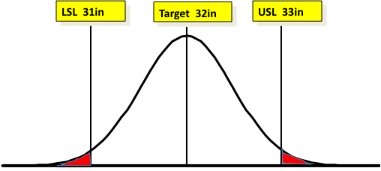
The second objective of Six Sigma is to reduce the variation in the process so that +/- 6 standard deviations (sigma) of your process are within the upper and lower spec limits.
In the long term, only +/- 4.5 standard deviations need to be within the limits. Why 4.5 standard deviations, you may ask? After all, it's called Six Sigma! Shouldn't that mean 6 standard deviations? Please see our
six sigma tutorial on calculation
for more information. A new window will open so you won't lose this six sigma tutorial page.
Graphically, this would mean that we would squeeze the curve and make it narrower, since the new process will have less variation than the old process. The even newer process may look like this.
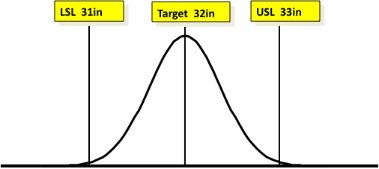
Now you can see that there is hardly any part of the curve outside the spec limits. Now that this process has reached six sigma level, only 0.00034% of the jeans will be defective due to the wrong waist size. Much better than the initial 40%! All with the help of the Six Sigma tools and methodology!
Leave "Six Sigma Tutorial" and go back to "What is Six Sigma?"