|
Capability StudyThe capability study is one of the main tools of Six Sigma. It helps us understand what our process capability is and tells us the probability that the process will produce defects. There are 4 main metrics used to define capability. These are Cp, Cpk, Pp, and Ppk. The two metrics starting with "C" measure short term capability. The other two starting with "P" measure long term performance. To remember easily, the "C" can be remembered as capability and the "P" can be remembered as performance. The two main objectives of traditional six sigma are to center the process to the target, and then reduce the variability If you haven't already, please take a look at our
tutorial on the objectives of six sigma.
Let's first start with Cp. Cp is the capability metric that tells us how good our process variation is compared to our tolerance. It compares our process spread to the tolerance spread defined by the customer. The formula for calculating Cp is shown below. (USL = upper spec limit, LSL = lower spec limit, s = standard deviation)
- Mean = 32.2 inches
What does this mean? If you wanted to equate Cp to sigma level, you just multiply it by 3. This means that a Cp of 1 would give you a 3 sigma process and a Cp of 2 would give you a 6 sigma process. For our example above, the process variation can be considered to have a sigma level of about 2.5. You need to remember however, that Cp only compares the process variation to the tolerance and does not care about the target. Therefore it is only a measure of how tight or loose your process variation is. So, if we take the example above and say our process mean is 35 inches while our std deviation and specification remains the same…what will our Cp be? Still the same! Because Cp does not care that the spec target is 32. It only cares that the tolerance is +/- 1, making the total tolerance 2 inches. Even though your process is completely out of spec, your process variation is quite tight compared to the tolerance. Therefore always keep in mind that Cp is a good metric for you to judge internally how tight your process is, but it does not tell you how well you conform to the customer's specifications. That job is done by the Cpk metric. When you do a capability study using Cpk, it measures how well your process is centered as well as how much variation there is in it. To determine the probability of making defects, Cpk should be used. This is also the metric that the customer will be interested in as it shows how well your process conforms to the specs. The formula for calculating Cpk is below.
If we were to calculate Cpk for the process above, we would take the minimum between (32.2 - 31) / 3 x 0.394 and (33 - 32.2) / 3 x 0.394. The latter is the minimum, which us Cpk = 0.677. This means that our process sigma level is 2.031 sigma. It is far from the 6 sigma level that we want and our task will be to find ways to center the process and reduce the variation so that Cpk = 2 which would mean sigma = 6. Note: When the process is perfectly centered between the specification limits, Cp and Cpk will be equal.
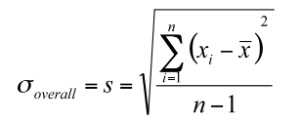
It is important to distinguish between Process Capability and Process Performance. Capability is assessed over a very short period of time and represents short term variation in the process. It does not consider the total variation, which would include the normal drifting and shifting of the process mean, as well as any changes in process spread. Process Performance is assessed over a long period of time and includes the effects of shifting and drifting of the process mean and changes in the process spread. Process Performance is the more realistic assessment of the process. It is what you can expect over the long term. Capability is the ideal situation. It is what you would expect if all shifts and drifting could be eliminated. Pp and Ppk calculation is the same as Cp and Cpk respectively. The difference is the method in which the standard deviation is calculated for Pp and Ppk. The formula for calculation the standard deviation for use with Pp and Ppk is given below.
The most important part of the concept of the capability study is to understand that: - Cp is a measurement of how tight your process variability is compared to the specification tolerance. The higher the Cp, the tighter your process variability. - Cpk is a measurement of how well your process is centered as well as how tight your process variability is. The higher the Cpk, the better your process is and the less chance it has of creating defects. - Pp and Ppk are the same as Cp and Cpk respectively, except that they show how your process performance is over the long term.
|